 示意预览
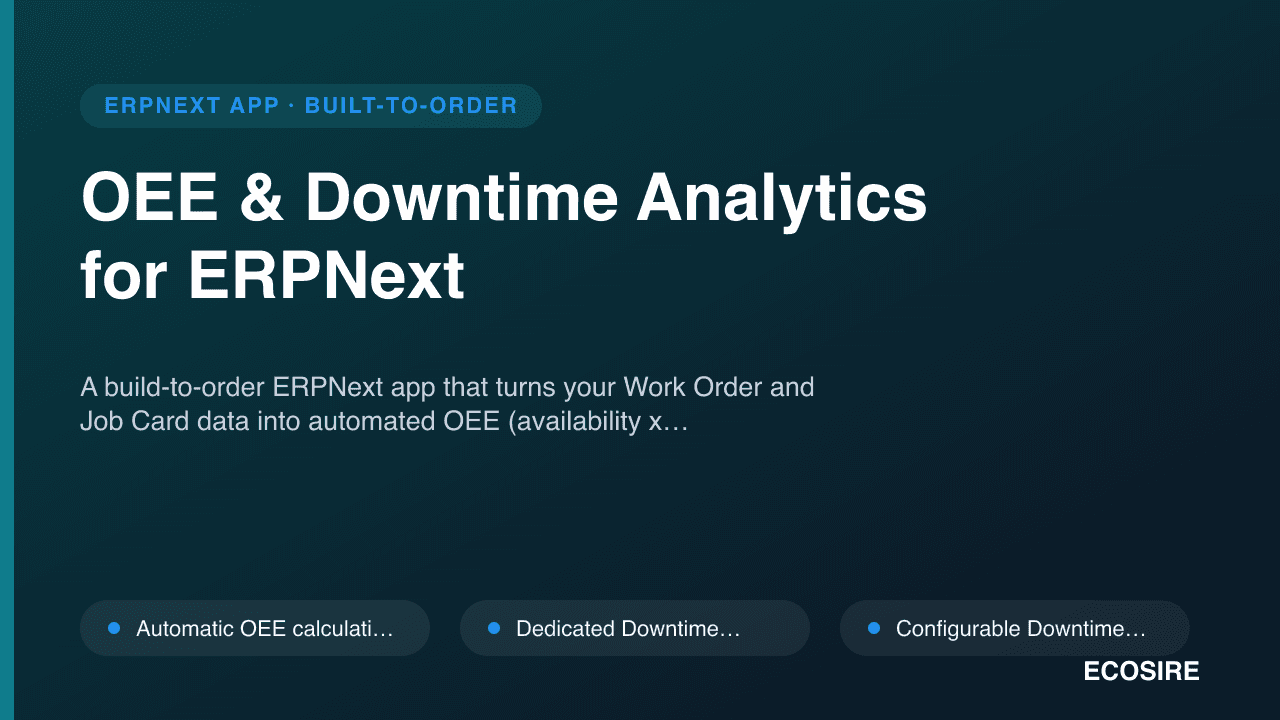
示意预览A build-to-order ERPNext app that turns your Work Order and Job Card data into automated OEE (availability x
performance x quality), downtime Pareto charts, and loss-reason dashboards by workstation, line, shift, and operator.
ECOSIRE scopes, builds, installs, and supports it on your Frappe v15/v16 bench.
什么是 OEE & Downtime Analytics for ERPNext?
A build-to-order ERPNext app that turns your Work Order and Job Card data into automated OEE (availability x performance x quality), downtime Pareto charts, and loss-reason dashboards by workstation, line, shift, and operator. ECOSIRE scopes, builds, installs, and supports it on your Frappe v15/v16 bench. Built to order by ECOSIRE for ERPNext v15, v16 — indicative price from $999.00 USD; request a quote for a scoped proposal.
核心功能
按需定制,全程代劳
无需自行搭建——由 ECOSIRE 构建、安装并提供支持的可用应用。
- 1
您下单
以一次性构建价格开始。我们在启动时与您共同确定范围。
- 2
我们构建与安装
ECOSIRE 在您的 ERPNext 上构建、配置并安装。
- 3
上线 + 支持
约一个工作周内上线,并包含两周上线支持。我们交付的代码中的缺陷免费修复。
技术规格
- ERPNext 兼容性
- —
- 许可证
- 许可证需要确认
- Python 要求
- Python 3.10+
- 数据库
- MariaDB 10.6+
关于此产品
Most manufacturers running ERPNext can see that a work center is busy, but not how effectively it runs. ERPNext core captures Job Cards, Work Orders, and time logs, and it exposes an operation time and a produced quantity, but it has no first-class concept of Overall Equipment Effectiveness. There is no availability-versus-performance-versus-quality split, no structured downtime reason capture, no six-big-losses classification, and no Pareto view of where minutes are actually being lost. Continuous-improvement and lean teams end up exporting Job Card data into spreadsheets, hand-calculating OEE after the fact, and arguing about definitions instead of fixing the line. By the time the number is compiled, the shift it describes is long gone.
ECOSIRE builds a proper Frappe app that adds a real OEE and downtime layer on top of your existing ERPNext production data. We introduce dedicated DocTypes — a Downtime Event log (with start, end, duration, reason code, and a link to the Job Card/Work Order/Workstation), a configurable Downtime Reason master mapped to the six big losses, and an OEE Snapshot that stores the computed availability, performance, and quality factors per workstation, line, and shift. Availability is derived from planned run time minus captured downtime, performance from ideal cycle time versus actual, and quality from good versus scrapped/reworked quantity pulled from your Job Card and Stock Entry data. The math runs automatically: hooks.py doc events on Job Card and Downtime Event recompute the affected snapshot on submit, and scheduler_events roll up shift and daily figures so dashboards are never stale.
On top of that data we build the analytics your team actually opens every morning. A downtime Pareto ranks loss reasons by lost minutes so you attack the vital few first; a six-big-losses breakdown separates breakdowns, setup and adjustments, small stops, reduced speed, startup rejects, and production rejects; and OEE trend charts drill from plant to line to workstation to operator and shift. Shop-floor capture is kept fast with a Frappe client script and a lean operator form so a downtime reason can be logged in a couple of taps without leaving the workstation. Everything is exposed through whitelisted server methods and the standard Frappe REST API, so the same numbers can feed a wall-mounted andon screen, Power BI, or your own reporting, and access is governed by proper role profiles and DocType permissions so operators, supervisors, and CI managers each see the right scope.
Because this is build-to-order, nothing is a generic download you have to bend to fit. We start with a short scoping call to pin down your line and shift model, your ideal cycle times, and your reason-code taxonomy, then build the app against your actual Workstation, Operation, and routing structure and target your Frappe/ERPNext v15 or v16 bench. Typical delivery is one working week from confirmed scope. You get the installable source, UAT on a staging site, a rollback plan, documentation, a training session for your CI and supervisor team, a post-go-live support window, and the git repository handed over so the code is yours to keep.
你得到什么
- Installable Frappe app source code for your commissioned version (v15 or v16), built against your actual Workstation and routing structure
- Installation and configuration on your bench, including reason-code taxonomy, ideal cycle times, and role profile setup
- Technical documentation covering DocTypes, hooks.py doc events, scheduler events, and the whitelisted REST endpoints
- User guide plus a live training session for your CI managers, supervisors, and shop-floor operators
- UAT on a staging site with a documented rollback plan before any production go-live
- Post-go-live support window for bug fixes and configuration adjustments
- Git repository handover so the source code is yours to keep, fork, and extend
- OEE calculation definition sheet documenting exactly how availability, performance, and quality are derived for your process
这是给谁的
Continuous-improvement / lean manager
Owns the OEE number and needs a single trusted definition across every line, plus a downtime Pareto that tells them where to run the next kaizen instead of waiting on month-end spreadsheets.
Production / plant manager
Wants live visibility of how each line and shift is actually performing versus target, with the ability to drill from a plant-level OEE down to the specific workstation and operator dragging it down.
Maintenance / reliability engineer
Needs structured breakdown and small-stop data mapped to the six big losses so they can separate genuine equipment failures from setup and speed losses and plan preventive maintenance around real downtime patterns.
Shift supervisor / line lead
Captures downtime reasons in real time from the floor and needs a fast, low-friction form plus a shift scoreboard, without navigating deep into ERPNext during a running shift.
OEE & Downtime Analytics for ERPNext 如何比较
| 标准 | 伊科西尔 | 定制建造 | 竞争对手 | ERPNext 原生 |
|---|---|---|---|---|
| OEE calculation | Automatic availability x performance x quality, recomputed on Job Card submit | Possible but you design and maintain the whole formula and refresh logic | Often a fixed OEE formula that may not match your definitions | No OEE concept; time and quantity captured but never combined |
| Downtime reason capture | Structured Downtime Event DocType + configurable reason master, six-big-losses mapped | Build the DocTypes and mapping yourself from scratch | Some reason logging, taxonomy rarely matches your plant | No structured downtime or loss-reason capture |
| Pareto & loss analytics | Downtime Pareto + six-big-losses breakdown + drill-down trends out of the box | Report-by-report, built and paid for one at a time | Fixed dashboards, limited drill-down beyond the vendor's design | Only generic list/report views; no Pareto or loss classification |
| Fit to your process | Built to your lines, shifts, cycle times, and reason taxonomy during scoping | Fully bespoke, but at full custom time and cost | Generic; you bend your process to the app's assumptions | Generic ERPNext manufacturing only |
| Frappe v15/v16 support | Targeted and tested against your exact bench version | Depends entirely on your developer's diligence | Depends on the vendor's release cadence and upgrade support | Native to your ERPNext version, but without OEE features |
| Source code ownership | Full git repository handed over; yours to keep and extend | You own it, but you carry all build and maintenance cost | Usually closed or license-locked; no repo handover | N/A; nothing custom delivered |
| Delivery model | Build-to-order, one working week from confirmed scope, UAT + rollback plan | Weeks to months depending on in-house capacity | Instant install, but generic and often needs heavy configuration | Already present, but the OEE capability simply does not exist |
| Support after go-live | Included support window + optional ongoing/upgrade engagements | Whatever your team can spare | Vendor support tiers, variable responsiveness | Community/your own ERPNext support only |
关于OEE & Downtime Analytics的常见问题
How long does delivery take?
This is a build-to-order app, not an instant download. After a short scoping call to confirm your line/shift model, ideal cycle times, and reason-code taxonomy, typical delivery is one working week from confirmed scope. Larger multi-plant taxonomies or heavy integration work can extend that, and we will tell you the honest estimate before you commit.
Does this work with our existing ERPNext production data?
Yes. It is built on top of your existing Work Orders, Job Cards, Operations, Workstations, and Stock Entries rather than replacing them. Availability comes from Job Card time logs, performance from ideal versus actual cycle time, and quality from good versus scrapped/reworked quantity. We do not require you to re-key production data into a separate system.
How is OEE actually calculated, and can we control the definitions?
OEE is availability x performance x quality. Availability = planned run time minus captured downtime; performance = ideal cycle time versus actual output; quality = good versus rejected/reworked quantity. During scoping we agree the exact inputs, your ideal cycle times, and your downtime reason taxonomy, and we hand over a definition sheet so the number is never ambiguous or disputed later.
Which Frappe and ERPNext versions are supported?
We build and test against Frappe/ERPNext v15 and v16. Tell us your exact bench version during scoping and we target that. If you are mid-upgrade we can plan the build against the version you will be running at go-live.
How does downtime get captured on the shop floor?
We add a lean Downtime Event capture form with a Frappe client script so an operator or line lead can log a reason code against the running Job Card in a few taps, without navigating deep into ERPNext. Reason codes are a configurable master mapped to the six big losses, and events are automatically linked to the Work Order, Job Card, and Workstation.
What about support and updates after go-live?
Every build includes a post-go-live support window for bug fixes and configuration adjustments. Because you receive the full git repository, your own team can also maintain and extend the app. Beyond the included window, ECOSIRE offers ongoing support and version-upgrade engagements (for example, carrying the app forward to a future Frappe major version) as a separate arrangement.
Can the OEE data feed dashboards or systems outside ERPNext?
Yes. The computed factors are exposed through whitelisted server methods and the standard Frappe REST API, so the same numbers can drive a wall-mounted andon screen, feed Power BI or another BI tool, or be consumed by your own reporting. Access is governed by proper role profiles and DocType permissions.
相关模块
OEE & Downtime Analytics
A build-to-order ERPNext app that turns your Work Order and Job Card data into automated OEE (availability x performance x quality), downtime Pareto charts, and loss-reason dashboards by workstation, line, shift, and operator. ECOSIRE scopes, builds, installs, and supports it on your Frappe v15/v16 bench.
- Automatic OEE calculation (availability x performance x quality) per workstation, line, and shift, recomputed on Job Card submit via hooks.py doc events
- Dedicated Downtime Event DocType linking start/end timestamps, duration, and reason code to the originating Job Card, Work Order, and Workstation
- Configurable Downtime Reason master mapped to the six big losses (breakdowns, setup/adjustments, small stops, reduced speed, startup rejects, production rejects)
- Availability loss derived from planned run time minus captured downtime, sourced from Job Card time logs